Seattle Bubble has moved! Redirecting...

You should be automatically redirected. If not, visit http://seattlebubble.com/blog/and update your bookmarks.

Off-topic comment? Interesting link?
Head over to the forums, or click here for open threads.

Showing posts with label NWMLS. Show all posts

Tuesday, May 08, 2007

April Reporting Roundup

Here's a compilation of what your local press (aka real estate advertisers) had to say about last month's home sales data from the NWMLS. It's depressing to think that these sources are where most people get their news of the market from...

Elizabeth Rhodes, Seattle Times:
King County home prices keep rising, bucking national trend
Buying a home here: You'll pay even more

"Overall, people have been getting worn out paying what in their opinion is an inflated price," Martin said.

Plus there are significantly more properties to choose from compared with a year ago.
Mrs. Rhodes' article is riddled with inaccurate assertions such as a claim that decreasing sales are "explained" by increasing inventory (huh?), and a quote that sales activity is "improving" and "at a faster pace than last year." She also says "Whether April will be the strongest month remains to be seen," when in fact it is already known that March experienced both more sales and larger price increases than April. Take home lesson: When reality isn't as rosey as you'd prefer, just pretend that it is!

Aubrey Cohen, Seattle P-I:
Home sales in city shoot up 14% in April
Anshul and Christine Pandhi were in their second week of seeing what they could get for $500,000 to $700,000 if they moved from Tacoma to Seattle.

"It's expensive," Anshul Pandhi said. "In our price range, the pickings are pretty slim."

John and Sahrah Marcantonio sold their Woodinville house in November and have been renting in Seattle while looking for a house in the city.
...
Sahrah Marcantonio was pessimistic about the market, but didn't care.

"I think it's a bubble, we're at the peak of the bubble, and yet, I want a house now," she said. "It's for the long term."
Aubrey's article was much more even-handed than we've come to expect. I was floored by the quotes he managed to get out of recent home buyers.

Devona Wells, Tacoma News Tribune:
Housing market still shows signs of slowing
The jump in the number of Pierce County houses and condos for sale puts the county at a six-month supply, generally considered the point a market moves from one favoring sellers to one favoring buyers, said Dick Beeson, a Windermere real estate broker and MLS director.

"The news is, pay attention, sellers, you’re not going to have the spring and summer you usually have," he said.
Apparently the market just south of us is a bit harder to spin in a positive light. Of course, that doesn't mean they aren't trying...
...though sales have slowed, [John L. Scott agent David Gala] said Tacoma homes under $400,000 remain hot. Two of his listings priced at $250,000 and $210,000 sold in the last week after multiple offers, Gala said.

But agents say three to six months tends to be the time it takes to sell a home today. As recently as two years ago, homes often sold in a few days.
Mike Benbow, Everett Herald:
Buyers drive up condo sales
While Snohomish County houses are less expensive than in King County, they're still out of reach for many people in the market, especially with the tightening of loan qualifications that has followed the recent increase in home foreclosures.

That has attracted more people to condos and their much lower price range.
Those buyers had better get into any type of home they can possibly afford, because as everyone knows, if they don't buy now, they'll be (you guessed it) priced out FOREVER!

Rolf Boone, The Olympian:
Condos sustain housing market
The pace of new South Sound loan applications has so far been strong this year, said Jeff Devlin, a Wells Fargo Home Mortgage consultant. Devlin said he doesn't sense the "doom and gloom" today that hung over the real estate market a year ago.
Hmm. Year over year pending (res + condo) sales down 15%, listings up 50%. SFH median up 9% vs 23% (April '05-'06). But the market is in better shape today than a year ago. Yeah.

Just for kicks, here are a couple of stories from a little further out in Western Washington than we usually focus on.

Dave Gallagher, Bellingham Herald:
Home sales slowing as supply rises

Evan Caldwell, Longview Daily News:
Region's home sales bucking U.S. trend

(Elizabeth Rhodes, Seattle Times, 05.08.2007)
(Aubrey Cohen, Seattle P-I, 05.08.2007)
(Devona Wells, Tacoma News Tribune, 05.08.2007)
(Mike Benbow, Everett Herald, 05.08.2007)
(Rolf Boone, The Olympian, 05.08.2007)

Monday, May 07, 2007

Listings Way Up, Sales Continue Descent

It's time for April statistics from the NWMLS. King County SFH summary:

April 2007
Active Listings: up 38% YOY
Pending Sales: down 10% YOY
Median Closed Price: $465,000, up 11% YOY

Sales continued their descent, making April the 17th of the last 18 months to register a YOY decrease in pending sales. Likewise, inventory continues to balloon, registering the highest YOY increase to date.

Despite the downward pressure of increasing supply coupled with decreasing demand, median prices still rose $10,000, for a 10.85% YOY increase. Apparently the increasingly small number of people that are still buying are all too happy to continue paying higher prices. Perhaps they're frightened of being priced out forever.

Months of supply bumped back up to 3.00.

As is the custom, I have uploaded an updated copy of the Seattle Bubble Spreadsheet that contains the relevant data. Here is the recap NWMLS pdf.

Here's the supply/demand YOY graph:

Here's the chart of supply and demand raw numbers:Here's the graph of YOY percent change in the median sale prices of single-family homes in King County since 1994:I predict that the $10,000 increase in median prices will be the primary focus of our friends at the Times and P-I.

Tick, tock, tick, tock...

Monday, April 09, 2007

March Reporting Roundup

Back from my busy week of travel and recharged over the Easter weekend, it's time to post the March roundup.

As usual, let's kick things off with Seattle's #1 real estate cheerleader, Ms. Rhodes, with her fawning article about all about how great and wonderful it is that median prices increased last month.

After stalling for two months, home prices in King and Snohomish counties perked up last month, disappointing potential buyers who thought slowing price appreciation had presented an opportunity.

Brian and Jennifer Rutherford are experiencing King County's strengthening real-estate market firsthand as they shop for a Bellevue home in the $500,000 range.
...
"We were just hoping things would cool off. It might have cooled off from its highest point, but not too far," he said. "Now we're making more of an effort to step up our looking."
...
Thursday's news that Microsoft is leasing 1.3 million square feet of Bellevue office space, enough to house 4,000 employees, is a near guarantee that Brian Rutherford is correct about home-buying prospects.
...
Lennox Scott, chairman of John L. Scott Real Estate, said a shortage of affordably priced homes will keep the local market strong.
Wait, what? Am I the only one that sounds like utter nonsense to? Less affordable = strong market? Hmm.

Surprisingly, Mr. Cohen of the P-I chose to focus primarily on Seattle proper, where the picture is somewhat more grim.
There are more homes on the market in Seattle these days -- and their prices slowly are creeping up.

The number of homes increased by nearly half in March from March 2006, according to data the Northwest Multiple Listing Service released Thursday. The median home price was $418,000 — up 2.7 percent from a year earlier and 3.2 percent from February 2007.

The median price for a Seattle single-family house went up 4.5 percent from a year earlier, to $460,000, while the median condo price was up 5.8 percent, to $316,950.
Of course, a Cohen article wouldn't be complete if it didn't end on an upbeat with the same-old "strong market" arguments repeated yet again:
In a statement accompanying the Northwest MLS numbers, Mike Skahen, owner of Lake & Co. Real Estate, called the market for close-in Seattle neighborhoods "hotter right now than it was at this time last year," with homes in virtually every price range attracting multiple offers.

Dick Beeson, owner of Windermere Real Estate/Commencement Associates in Tacoma, said, "It just feels like a normal market with well-priced homes seeing offers in 30 days or less and sellers of overpriced properties having a gut check and a motivation check to see if they really are serious about selling."

Recent revelations about failing loans in the subprime market, which serves those with poorer credit, have caused trepidation about the national housing market.

But the Puget Sound region is fairly well protected from this because of its healthy economy, continued home price appreciation and fewer subprime loans compared with other parts of the country, said Erik Hand, president of John L. Scott Real Estate subsidiary Response Mortgage Service, in the MLS statement.
Ahh, that's better.

Down in Tacoma, it's getting harder to ignore the picture that the numbers are painting:
The median price was $274,950, up 5.8 percent over the same month a year ago, though down from February, according to figures released today by the Northwest Multiple Listing Service.

Sales, however, continued to fall as the number of listings skyrocketed to 6,554 – up 48.6 percent from March 2006.
...
Bob Niehl, an agent for Crescent Realty, said Thursday that it’s not uncommon for the kind of house that once would draw multiple offers to sit for more than 100 days.
The Everett Herald appears to be doing somewhat of a victory dance, proudly proclaiming Snohomish County as immune to supply and demand.
Prices for homes and condominiums in Snohomish County continue to soar, even as sales of both in March continued to be down compared with a year ago.

The median price for single-family homes hit $382,550 countywide last month, according to the Northwest Multiple Listing Service report issued Thursday. That's nearly 16 percent higher than the median of $330,000 in March 2006.

Prices rose despite a 44 percent increase in the number of homes listed for sale from year to year and a nearly 18 percent drop in pending sales.
Finally, down in Olympia, slowing sales are all too obvious.
Thurston County single- family home and condominium sales dropped 7.5 percent in March, though last month’s results were softened by a surge in the condo market, the Northwest Multiple Listing Service reported Thursday.
...
Other year-to-year March home sales data for Thurston County:

• Total active listings for single-family homes increased 38 percent to 1,802, up from 1,303.
• The median price of a single-family home rose 4 percent to $254,950, up from $244,900.
• Total active listings for condos increased 133 percent to 49 units, up from 21.
• The median price of a condo dropped nearly 6 percent to $171,203, down from $182,000.
Sounds like a stellar spring bounce all around the Sound, wouldn't you say?

(Elizabeth Rhodes, Seattle Times, 04.06.2007)
(Aubrey Cohen, Seattle P-I, 04.06.2007)
(Devona Wells, Tacoma News Tribune, 04.05.2007)
(Eric Fetters, Everett Herald, 04.06.2007)
(Rolf Boone, The Olympian, 04.05.2007)

Thursday, April 05, 2007

Sound Familiar? Sales Down, Listings Up.

March numbers from the NWMLS are available, and I managed to get a bit of a break before I head back from Chicago, so here comes the data.

March King County SFH summary:

March 2007
Active Listings: up 33% YOY
Pending Sales: down 11% YOY
Median Closed Price: $454,950, up 12% YOY

After an unusual YOY increase in February, sales resumed their previous course of down, down, down. This was the second year in a row that March sales were down 11% YOY.

If anyone tries to claim that this year is shaping up "just like any other year," or that the sales data points any less toward a softening than it has in recent months, they are either in denial or mentally handicapped. Month-to-month inventory jumped 10.42% from February to March, a larger spike between those months than any other year since 2000 (pre-2000 data is not available). February to March sales were up just 14.11%, making this the smallest increase between those months than any year since 2000.

While months of supply is still relatively low, it has increased 49% since March last year, and days on market has increased 33%. Still-increasing median prices are pretty much the only thing that housing bulls have to be happy about.

As is the custom, I have uploaded an updated copy of the Seattle Bubble Spreadsheet that contains the relevant data. The recap NWMLS pdfs are not available yet, but here is the detailed King County data.

Here's the supply/demand YOY graph:


Here's the chart of supply and demand raw numbers:Here's the graph of YOY percent change in the median sale prices of single-family homes in King County since 1994:You've got a little bit of a recovery last month, with "appreciation" increasing 3 points to 12%. We'll see what happens the rest of the spring.

Wednesday, March 07, 2007

Sales Up, Inventory Up More, Prices Flat

February statistics from the NWMLS have been posted. As is the custom, the Seattle Bubble Spreadsheet has been updated and uploaded.

Some of my guesses for King County were fairly close, with the notable exception of Pending Sales (Res), which shot up to 2,375. That's +7.66% YOY, ending the 15-month streak of declining YOY sales.

Interestingly, despite the sudden surge in buyers last month, the median price was essentially flat compared to January, thus leading to the first single-digit YOY increase in median price (+9.41%) in over two years. This could be because although the number of sales is finally on the rise, the amount of inventory is still rising considerably quicker (+7.66% vs +22.50%).

Here are the vitals, with my guesses following:

Median Price (Closed)
Res + Condo: $393,250, +14.00% ($372,000)
Residential: $429,925, +9.41% ($425,000)
Condo: $285,250, +24.59% ($272,500)

Res Only
Active Listings: 6,124, +22.50% (6,250)
Pending Sales: 2,375, +7.66% (1,900)
Here's the supply/demand YOY graph:Here's an update to the graph I posted last month of the YOY percent change in the median sale prices of single-family homes in King County since 1994:I predict that the local press will focus their reports on the increased number of sales, while downplaying the still-declining rate of "appreciation." Just a hunch.

(NWMLS, February 2007 Recap, 03.2007)

Friday, February 09, 2007

Our Present Real Estate Cycle

Just for kicks, let's take another look at the home price YOY change graph that I posted on Wednesday.

I noted that the downward curve on the right that represents the last nine months looks fairly steep. But just how steep is it, compared to the rest of the graph?

In order to get a feel for the "cyclic nature of the market" I ran some calculations. Since things were slowing down at the beginning of the available data (1993), I defined a complete cycle as a slowdown, trough, speedup, plateau. I calculated the average month-to-month change in year-over-year home prices for each slowdown, trough, speedup, and plateau.

In other words, when "appreciation" was on the rise, how quickly was it rising? When it was declining, how quickly was that? I did a little number-crunching, and here are the results.

Cycle #1: January 1994 — June 1998
Slowdown: January 1994 — March 1995
Median YOY Start: +5.33%
Median YOY End: -1.77%
Total Change: -7.10 points
Time Elapsed: 14 months
Average Monthly Change: -0.51 points

Trough: March 1995 — September 1995
Median YOY Start: -1.77%
Median YOY End: -1.82%
Total Change: -0.05 points
Time Elapsed: 6 months
Average Monthly Change: -0.01 points

Speedup: September 1995 — February 1998
Median YOY Start: -1.82%
Median YOY End: +15.10%
Total Change: +16.92 points
Time Elapsed: 29 months
Average Monthly Change: +0.58 points

Plateau: February 1998 — June 1998
Median YOY Start: +15.10%
Median YOY End: +14.67%
Total Change: -0.43 points
Time Elapsed: 4 months
Average Monthly Change: -0.11 points

Cycle #2: June 1998 — April 2006
Slowdown: June 1998 — March 2001
Median YOY Start: +14.67%
Median YOY End: +0.35%
Total Change: -14.32 points
Time Elapsed: 33 months
Average Monthly Change: -0.43 points

Trough: March 2001 — June 2003
Median YOY Start: +0.35%
Median YOY End: +1.72%
Total Change: +1.37 points
Time Elapsed: 27 months
Average Monthly Change: +0.05 points

Speedup: June 2003 — October 2005
Median YOY Start: +1.72%
Median YOY End: +20.00%
Total Change: +18.28 points
Time Elapsed: 28 months
Average Monthly Change: +0.65 points

Plateau: October 2005 — April 2006
Median YOY Start: +20.00%
Median YOY End: +18.17%
Total Change: -1.83 points
Time Elapsed: 6 months
Average Monthly Change: -0.31 points

Cycle #3: April 2006 — ???
Slowdown: April 2006 — Present
Median YOY Start: +18.17%
Median YOY Present: +10.13%
Total Change: -8.04 points
Time Elapsed: 9 months
Average Monthly Change: -0.89 points

As you can see, the slowdown we are currently experiencing is nearly twice as rapid as either of the two previous slowdowns since 1994. Clearly this does not tell us anything about what is going to happen in the near future, but it's definitely an interesting point to note, and one that you're not likely to read in the local newspaper or the blogs by those in "the industry."

Down and down it goes, where it stops... nobody knows.

Wednesday, February 07, 2007

Guess What? Inventory Up, Sales Down.

An inside source has supplied me with the latest NWMLS statistics, and they tell exactly the story you would expect if you've been paying any attention at all during the prior nine months. For what is now the tenth month in a row, inventory was up and sales were down YOY. In fact, sales have been in the negative YOY since November 2005, making January the fifteenth consecutive month of declining sales.

Here's your SFH summary:

January 2007
Active Listings: up 22% YOY
Pending Sales: down 6% YOY
Median Closed Price: $429,495, up 10% YOY

As is the custom, I have uploaded an updated copy of the Seattle Bubble Spreadsheet that contains the relevant data. The public NWMLS pdfs are not available yet, but when they are I will update this post with the link. [Update: And, here it is.]

Here's the supply/demand YOY graph:

It would be a stretch to call the upward curve on the sales graph a "recovery" since it is still in negative territory, but sales are certainly now slowing as much in the last few months as they were during the summer months. Will we see the all-powerful "spring bump"? We'll know in just a few months...

Here's the chart of supply and demand raw numbers:Finally, just because I'm in a charty type of mood (also I'm in Atlanta and there's nothing much better to do), here's a graph of the YOY percent change in the median sale prices of single-family homes in King County since 1994:Wow, that latest dip sure is steep... Huh.

Tuesday, January 23, 2007

Listing History

My thoughts on the issue while working hard.

A balanced perspective

The dissemination of data from the NWMLS to the public will be limited for a variety of reasons. Safety and protection of potentially personal information of each seller is paramount.

I am uncertain whether the issue of safety and protection of personal information should fall into the category of “transparency” for everyone to see. Some things should be kept out of the general public view. For example, theft has been an ongoing issue for the membership of the NWMLS—meaning that listings are a target for thieves, including new construction (appliances disappearing, furnishings and even mechanical items such as copper and other equipment).

Most sellers probably would not be pleased if the brokerage posted the time the house was on the market. The implications of a languishing listing means it is probably overpriced or there is some other problem such as poor location, poor condition or a combination of factors.

Market Time & Re-listing

There may be companies such as Zip Realty or others that will indicate if a home was re-listed or will post the total time on market. I have not researched this. The idea of disclosing this information, particularly in a slowing market or correcting market as one may define it, has the potential to have a negative affect on the value of a home if you are a seller. As a buyer, this information allows for a more level playing field. Buyers certainly had little to grasp on during the past couple years when the market was so hot. Realtors recommended removing as many contingencies as possible when making an offer or consumers would have little chance to buy the home. For many buyers, this exacerbated an already difficult buying experience. I heard about it first hand from many who sat across from me while going over their closing documents.

From a consumer’s perspective, many want the Realtor community to shape up. Many want full transparency, but the matter is complicated. The issue of agency and representation does not allow for certain facts to be transparent. Agency and representation does have merit.

Tim Ellis is correct. Much of the market time data and re-listing that goes on is manipulated. It is manipulated to assist the seller in having a sound market position. So, the agent representing the seller is doing their job. However, the interesting phenomenon to see is how this issue is being dealt with through the in-house NWMLS membership. The agents were tiring of this routine themselves. Today, we have the cumulative days on market (CDOM) being recently introduced to hopefully reduce the manipulation within the membership of the NWMLS.

As Ardell DellaLoggia and others suggested, there are some techniques that agents utilize to work around the days on market issue—also re-list the same property having the CDOM counter show zero. Sometimes there are good explanations for this. Sometimes it is clear market manipulation.

If I were buying, I would want to know how long a home has been on the market and how many times the home has been re-listed. In addition, I would want my agent to confirm the sales history (which is now publicized on various web sites) and underlying financing (King Co. shut this down via website, but Snohomish Co. is still available via web). In a swift moving market, much of the information gathered could save a buyer from making a costly decision. Buyers are able to discern if the home was recently flipped and whether the improvements merit the asking price.

The benefit of providing a true picture of time on market or re-list history is that it would put pressure on the sellers to market and price the home in an authentic competitive manner. For Realtors, I would think this would be helpful. That type of transparency may trigger phone calls from sellers indicating that they need to make a change—either make it worth what they are asking or drop the price to a level that is more reasonable. Rather than the Realtor initiating the delicate conversation of dropping the asking price, the seller is opening up the door for that conversation first, based upon what the market is dictating.

-S-Crow, your consumer driven Sentinel.

Monday, January 22, 2007

If the MLS is an advertisement...

At the risk of beating a dead horse, I'd like to continue Friday's conversation about the re-listed house on Avondale.

Thanks to yet another reply by Ms. Reed as well as a series of replies from Ardell, it has finally gotten through my thick skull that "cancel and relist" is different from "let expire and relist." Ms. Reed is guilty only of the latter, which is technically not a violation of NWMLS rules.

Although I now understand the difference, it seems to me like a trivial distinction. Ardell claims that a seller's agent that uses a short listing agreement in order to be able to re-list an unsold property "takes the risk of being replaced as the seller's agent by having short contracts." However, it seems to me that once the benefits of re-listing (falsely appearing to be a "fresh" listing) are explained to the seller, they would be more than happy to keep the agent on board, knowing that this is an agent that is willing to pull whatever kind of tricks are necessary to sell their house.

In fact, Ardell had an awful lot to say on the matter. Here are a few quotes that I found most interesting:

The general public's perception [of the MLS], the one most focused on here...is really the least of our concerns.

I am sorry that no one wants to understand that the mls system is not meant for the public to use as a means for purchasing property without an agent.

The public's view [of the MLS] is an "advertisement" for the most part, and not a "sharing of the agent tool". ... It is just a small view of the big picture and one to give the public an "idea" of what is out there...not the whole story.
If the publicly-accessible portion of the MLS is an "advertisement," shouldn't it be held to truth in advertising standards? When a property appears as "new on market" despite having languished non-stop on the market for months upon months, how is that not a deceptive practice? To simply brush off such concerns by saying that the MLS is "not meant for the public" seems a bit cavalier to me.

Ms. Reed's tactic, which Ardell describes as both something that "we [agents] hate" and "an excellent job" appears to have paid off. As Ardell pointed out, the listing has gone to "subject to inspection," presumably meaning a twenty-five to thirty-five thousand dollar payday is in the beleaguered Ms. Reed's near future. When the transaction shows up in the public records, I'll post the last update on this house.

Friday, January 19, 2007

Update: Anecdote: Reloaded

Sarah Reed, the listing agent of the still-unsold $1.275 million-dollar home left a comment on my recent post about her listing. I feel it is only fair to reprint her comment here on the front page so that more people are able to read her defense.

So here it is, word for word.

Regarding my listing on Avondale-I wanted to set the record straight about my intentional relisting of the property. I try to always write a shorter listing agreement than the average agent as it better serves the client/seller. I do not "cancel and relist", or intend to deceive the consumer or other agents. I wanted the listing to expire contractually, and be relisted after the first of the year so that it would have an MLS # starting with 270. Largely because so many agents only search the new listings for their clients, overlooking perfectly fine homes with a bit of market time. Buyers always ask how long a property has been on the market, and I am always honest with my clients in every way. The Days On Market is clearly available to all agents, though the MLS does not print it to the consumer. My sellers always get a detailed explaination of my reasons for writing a shorter listing contract, and the benefits it gives them. Ultimately, the descision is theirs.

Certainly, I have had a few issues to overcome with this property, as the last agent blantantly overpriced it since he does not live in or do much business in the area. Also, he had it in the zip code for the city of Sammamish. Finally, the school district was wrong, and the photos were lack luster. The former agent really SHOULD have relisted the home with each of the massive price drops he was forced to do by his lack of accurate info and pricing, and did the sellers a huge disservice by not. He was likely afraid that they might cancel his service, which they were eager to do in the end. The home is very well constructed and finished nicely, and is finally appropriately priced. There was an appraisal done this summer for value only, and it came in at $1,550,000.

The current listing contract is written to expire the first week of March. I did this to appeal to the lazier agents out there that only search for "new listings". More paperwork for me, but I'm not lazy.

One more thing. I agree that there are alot of unprofessional agents out there harming the public. It would be valuable to the industry and the safety of the consumer if we had stricter regulations surrounding the obtaining of a real estate license in this state. If you ever get the chance to vote for stricter guidlines and laws for real estate professionals, PLEASE DO! We try to be a self-policing industry, but not everyone shares the high ethics that we all should subscribe to. Unfortunately, there are alot of people that get in the business to take advantage of the public.
I'm not really sure what point Ms. Reed is trying to make here. Again, I'm no real estate professional, but the rule seems pretty clear-cut to me: "You may not cancel and relist a property, even with a new listing agreement and new listing input sheets, unless there is a material change to the listing" (emphasis mine).

I don't understand how "I try to always write a shorter listing agreement than the average agent" excuses Ms. Reed from the rules.

Perhaps one of our readers from Rain City Guide can enlighten me?

P.S. (Please refrain from making personal attacks on Ms. Reed in the comments. Thank you.)

Friday, January 12, 2007

Anecdote: Reloaded

Many of you may remember the million-dollar new construction that I've been following since June of last year. Recall that it was originally listed at $1,625,000, has seen four separate price reductions (down to $1,275,000—28% off), and was most recently re-listed with a new brokerage and a shiny new description.

About a year ago I posted about a warning the NWMLS had posted to local agents. Here's the heart of it:

You may not cancel and relist a property, even with a new listing agreement and new listing input sheets, unless there is a material change to the listing (e.g., a significant change in the price of the property, a remodel, a change in zoning, or a change in ownership).
What does this have to do with the listing in question? Well, after fifty more days of apparently zero interest in this increasingly stale listing (240 cumulative days on the market), the listing agent—one Miss Sarah L. Reed of RE/MAX—has apparently decided that the new year is a good time to generate some fresh interest in the property by brazenly violating NWMLS rules.

Old price: $1,275,000. Old description:
A warm & elegant tribute to the distinctive northwest craftsman lifestyle! New majestic custom home on over 3 peaceful, close-in acres w/equestrian opp. Featuring glistening hardwoods in sun-filled rooms, arched doorways, library, slab granite, state of the art stainless steel gourmet kitchen-6 burner viking. Open & flowing w/soaring ceilings, greatroom, dining, family~bonus designed for entertaining. Showcase master suite retreat w/fplc, spa bath, dual closets. Caretaker-nanny-ext.Family wing.
"New" price: $1,275,000. "New" description:
A warm & elegant tribute to the distinctive northwest craftsman lifestyle! New majestic custom home on over 3 peaceful, close-in acres w/equestrian opp. Featuring glistening hardwoods in sun-filled rooms, arched doorways, library, slab granite, state of the art stainless steel gourmet kitchen-6 burner viking. Open & flowing w/soaring ceilings, greatroom, dining, family~bonus designed for entertaining. Showcase master suite retreat w/fplc, spa bath, dual closets. Caretaker-nanny-ext.Family wing.
You can also see (if you have a ZipRealty account) that the pictures are identical between the old and new listings.

I'm just an unsophisticated blogger, not a real estate professional, but it sure doesn't look to me like there has been a "material change to the listing." Tsk, tsk Ms. Reed.

Seeing something like this almost exactly one year after posting about the NWMLS warning leads me to wonder whether January is perhaps a particularly popular month to violate the NWMLS rules regarding re-listing properties.

Update: Be sure to see Sarah Reed's response to this post.

Friday, January 05, 2007

Inventory Up, Sales Down (Sound Familiar?)

December stats are available from the NWMLS. Here's a summary of the "residential" figures:

Active Listings: up 23% YOY
Pending Sales: down 9% YOY
Median Closed Price: $440,000, up 12% YOY.

I'll update this post later today with the usual graph and links to the updated spreadsheet and the NWMLS pdfs.

Update: Sorry about the delay. Here's the Seattle Bubble Spreadsheet, and here is the latest inventory & sales graph:

As you can see, inventory jumped slightly less YOY than it has in recent months, and sales dropped YOY slightly less than they have in recent months. Is this the beginning of a trend toward inventory and sales stabilization? I'm going to go with "no" for now. We'll really see come March.

Thursday, December 07, 2006

November: Inventory & Sales Trends Continue

The November NWMLS statistics have been published, and overall they came in pretty close to what I predicted a week ago. Here are the vital statistics for King County, along with my predictions:

[Statistic: Predicted, Actual]
Med. Closed Price (Res): $435,000, $435,000
Med. Closed Price (Condo): $260,000, $272,950
Active Listings (Res): 7,250, 7,040
Pending Sales (Res): 2,000, 1,985
As I expected, last month's bizarre price spike was erased, as the median closed residential price returned to the level set in June. Active listings and pending sales showed little sign of slowing their respective trends of double-digit YOY percentage change, with listings up 27.7% and sales down 14.2% from November 2005. As usual, the Seattle Bubble Spreadsheet has been updated with these latest numbers.

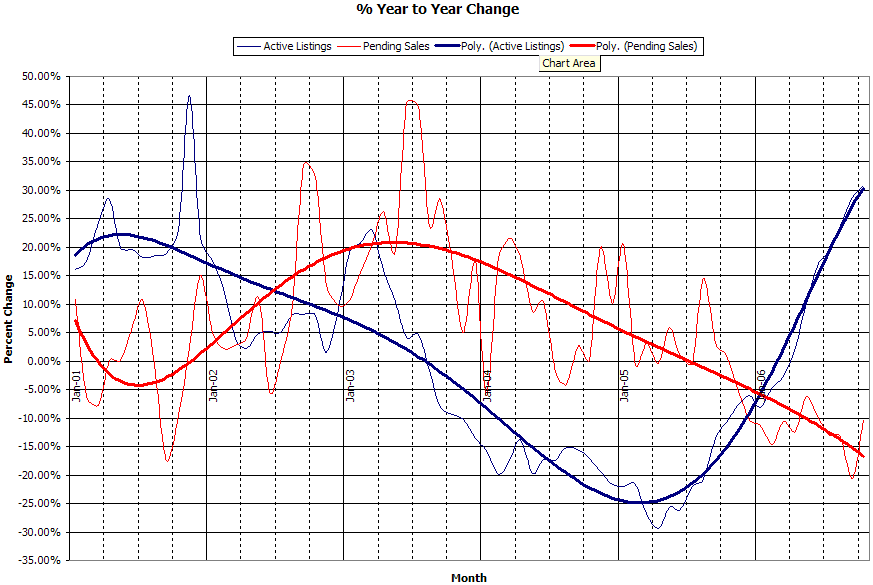
Here is the YOY % change graph for active listings and pending sales:The Active Listings curve is becoming just a tad less steep, but interestingly, the downward slope of (averaged) pending sales has been virtually a straight line since late 2003. If either of these trends continue—even at a reduced rate—into next year, we could see a true buyer's market (6+ MOS) in King County by next November. I'm not necessarily predicting that, but it's definitely the direction the numbers are headed. Could some unknown influence cause a sudden change in the buying and selling trends? Absolutely. As of right now though, it would seem that economic and psychological pressures will continue to push things in the same direction that you see in the chart above.

Prepare for positive spin and finger-pointing at the weather from our friends in the local media in three, two, one...

(NWMLS, King County Statistical Report, 11.2006)

Update: I'm on a roll with accurate predictions:
Pending sales – transactions signed but uncompleted – were down 11 percent compared with a year earlier.
...
Wet weather and attention given to the mid-term election and the holidays may have affected sales, the MLS said.
...
"We have a little bit of a pause today," said Chris Pauling, president of Prudential Northwest Realty. But "Jobs and the strong economy are going to keep prices from falling," he said.
Positive spin? Check. Finger-pointing at the weather? Check. I'm 2 for 2!

Update 2: Here's the first paragraph of the November numbers article in the Puget Sound Business Journal:
Prices for homes in Western Washington continued to rise, but the number of pending home sales slid, partly because of weather woes.
Boom—2 out of 2 again, right out of the bag! It's almost too easy!

Thursday, November 16, 2006

New Number Crunching: Price Breakdowns

With great thanks to Alan (aka PugetHouse), I have added a new weapon to Seattle Bubble's statistical war chest: price breakdowns.* It is fairly common knowledge that although it is the most convenient indicator to discuss, the median sales price does not give a very complete picture of the changing housing market. Price breakdowns, i.e. how many homes sold each month in a given price range, will hopefully give us some additional understanding about what is really going on with home prices.

All the numbers below refer to closed "residential" sales in King County only. As usual, all the data and charts found in this post have been added to the Seattle Bubble Spreadsheet for your number-crunching pleasure.

The NWMLS breaks the data down into 29 different price brackets, but for ease of viewing, I have lumped the figures into the following five price brackets: 0 - <$250k, $250k - <$350k, $350k - <$500k, $500k - <$750k, & $750k & Up. To start off, here's a chart showing the percentage of total monthly sales that each bracket accounted for from 2005 through last month.

A particular point of interest is March of this year, when the percentage of homes sold in the $250k - $350k range took a 3.5 point nose-dive (30.5% to 27.0%), while the $500k - $750k range jumped 2.4 points (19.6% to 22.0%) and the $750k & Up range jumped 3.4 points (9.5% to 12.9%).

The most dramatic change was in the up to $250k price range, which plummeted from 22.2% of sales in January 2005 (median: $330,000) to a mere 3.8% in October 2006 (median: $440,000). Also worth noting is the approximate doubling of both the $500k - $750k range (from 12.7% to 25.4%) and the $750k & Up range (from 6.3% to 13.8%).

Here is another way of looking at the data:In this chart, I have plotted the percent change of each category's monthly share from its average share over the previous six months. For example, in the six months prior to January 2006, sales of homes in the 0 - $250k range made up 10.7% of all sales, while in January that range accounted for just 7.9% of sales, so the total share of sales for the 0 - $250k range was 25.8% lower in January 2006 than the previous six months. Since theoretically there should be little to no seasonal affects on the price breakdown percentages, I believe that a six-month average is a good way to look at the trend.

As you can see, the $250k - $350k and $350k - $500k price ranges tend to hold relatively steady, not deviating much more than +/- 10% most months. However, the low end (0 - $250k) has been consistently dropping, most months by over 20% of the previous six-month total. Also interesting is the surge in sales of $500k - $750k and $750k & Up during the spring and summer of this year, with the high end breaking the +20% barrier three times.

What does this all mean? Good question. Obviously if all homes were appreciating equally, we would expect to see the percentage of sales in the lower price ranges steadily decline, and the higher price ranges steadily increase. To some degree, that's what we are seeing here. On the other hand, the theory that an unusually large amount of high-end sales might be skewing the median upward certainly seems defensible, given the sustained spike in the upper two brackets since March.

I don't think this particular piece of the puzzle is enough data to draw any strong conclusions, but I definitely find it interesting.

* Although these statistics were gathered via searches of the NWMLS database, I should include the following disclaimer: Statistics not compiled or published by NWMLS.

Monday, November 06, 2006

Inventory Eases (Very) Slightly In October

The NWMLS has posted October statistics. Although residential (excludes condo) inventory did indeed follow its usual October downward course, the decrease of less than 1% of listings was the smallest since at least 2000 (I don't have reliable inventory statistics further back). The YOY increase in inventory stands at almost 31%—a new record—while the YOY decrease in pending sales eased to 10% (from 20% last month).

The statistic that I find most bizarre is the median price of closed residential sales, which increased $15k (3.5%) from last month. The median price has only increased by more than 3% from September to October one other time since 1993—in 1995.

Anyone out there care to venture a guess as to what the heck is going on? Have home buyers in King County all gone 100% mad? What could possibly have driven prices up another $15,000 in one month?

P.S. - The Seattle Bubble Spreadsheet has been updated.

Wednesday, October 04, 2006

Demand Down, Supply Up, Prices Dip

It's that time of the month again. Time for fun with numbers. September figures from the NWMLS have been posted. King County Residential inventory jumped even more than I was expecting, up 28.79% from last year. Sales tanked nearly 20% from August, and are down 20.59% from last year. Median sales price for single-family homes in King County actually decreased from August, down to $425,000 (up 11.48% from September 2005).

It is worth noting that the while inventory commonly increases from August to September, last month's 10% jump is the largest increase over that time period in at least the last seven years. Likewise, sales tend to decline in September, but last month's nearly 20% drop from August is the largest September drop since 2001. Furthermore, the last time that the median sales price from August to September dropped by more than last month's 2.30% was 1998.

Also interesting is the fact that the "months of supply" number (inventory / pending sales) shot up almost a full month—the largest jump since December 2000—from 2.54 to 3.49, a value not seen since Winter 03-04. If that rate of change stays steady (I doubt it will), we will reach six months of supply (generally seen as a "balanced market") before the new year.

As is traditional, I have uploaded an updated version of the Seattle Bubble spreadsheet for your number-crunching pleasure. Don't forget that you can always find the link to the spreadsheet on the sidebar.

Here are the supply & demand graphs.

Check out those curves.

Wednesday, September 06, 2006

Trend Marches On: Supply Up, Demand Down

August figures from the NWMLS have been posted. Inventory continued its climb, up 23.91% from last year, while sales were up slightly from July, but still down 13.29% from last year. Median sales price for single-family homes in King County was unchanged from last month, at $435,000. As is traditional, I have uploaded an updated version of the Seattle Bubble spreadsheet for your number-crunching pleasure.

Here are a few graphs from said spreadsheet.

Monday, August 07, 2006

July: Inventory Up, Sales Down (Yet Again)

Well I waited all weekend for the NWMLS "recap" pdf to be posted, and it's still not up. In the mean time, here are the pertinent numbers for King County (residential only), pulled from the summary sheet, which has been posted.

Active Listings: 6,909 (+ 19.29% YOY)
Pending Sales: 2,665 (- 13.08% YOY)
Median Closed Price: $435,000 (+0.01% M2M, +16.00% YOY)
Nothing too surprising. The trends of the last few months are just continuing—increasing inventory and decreasing sales. The median price pretty much stalled, but it seems to do that pretty much every July. (Last year it was unchanged at $375,000 from June to July.) Generally speaking, inventory tends to start decreasing month to month during the last half of the year, but as you can see, active listings are still increasing at over 6% per month. If the trend continues, I think we will start to see a real slowdown in the median price next spring.

Meanwhile, in Olympia...
Thurston County home sales continue to show signs of slowing as the South Sound housing market crossed into uncharted price territory last month.

For the first time, the average price of a single-family home rose above $300,000 in July, according to Olympic Multiple Listing Service data released Friday.

The average price of a home was 21 percent higher than last year at $301,129, while the median price of a home also was higher at $262,000, up 12 percent compared to July 2005.
...
Regardless of the increase in average and median prices, South Sound real estate professionals say there has been a noticeable shift in the market.

"The ratio of buyers to sellers has drastically flipped from the past," said Chad Roraback, a real estate agent with Abbey Realty in Lacey.

"The buyers haven't left the market; there is just so much more to choose from," he said.

Roraback attributed the surge in median and average home prices to sales of higher-priced homes.

Sales of homes priced at more than $450,000 have doubled since 2005, climbing from 106 to 216 home sales in 2006, an increase of 104 percent.

Roraback also thinks inventory levels are much higher in Thurston County than the Olympic MLS data would indicate because large home builders don't always list every home available.

The number of homes on the market is more in the range of 2,200 to 2,500, he estimated.

"I just think we will be flattening out and take a while to absorb the inventory," he said. "The population growth isn't going to match the number of homes available right now. Builders may have to slow down production."
At 1,928, the total active listings (residential & condo), Thurston County is already over 80% higher than a year ago. If they're really looking at 2,500, that's an over 100% increase. I don't see how that kind of increased inventory can sustain continued price increases. I guess that's why I'm not an economist.

(Rolf Boone, Olympian, 08.05.2006)
(NWMLS, 08.2006)

Update: The recap pdf has been posted. Also, the big Seattle Bubble Spreadsheet has been updated to reflect the July numbers.
Please read the rules before posting a comment.

Thursday, July 06, 2006

June NWMLS: Demand Down, Supply Up

June NWMLS numbers are out (pdf). Short story: King County median home sold for $434,950, which was 16% more than June 2005 (compared to 15.51% May '05 - May '06), and 1.64% more than May 2006. Active listings continued their climb, up 17.17% from June 2006, while pending sales continued their slide, down 10.14% from a year prior.

Look for the rah, rah, real estate stories in all your favorite local news outlets in 3...2...1...

(NWMLS, 07.06.2006)

Tuesday, June 06, 2006

Inventory Up, Sales Down (Still)

Yes, the May MLS numbers are out. Here are direct links to the full NWMLS stats and the King County "breakouts" (PDFs). So far I've seen just one news report on the numbers, a blurb in the Puget Sound Business Journal:

Buyers looking for homes near the job centers of Seattle and Bellevue won't find as many houses for sale compared with the outlying areas, according to the latest report from the Northwest Multiple Listing Service (NWMLS).

And the prices paid for homes in King County continue to rise, the report says.

The median price paid for a single-family home (not including condominiums) in King County last month was $427,950, up from $370,500 a year ago.
...
"We continue to see a lack of viable inventory in those areas close to the job centers in Bellevue and Seattle, while the outlining areas have leveled out and now have more than enough supply for the demand," said Lennox Scott, chairman and CEO of John L. Scott Real Estate, in a statement.
...and I continue to not buy that as an explanation for the decrease in sales. Just like last month, inventory is creeping up (KC homes +10% compared to May '05) while sales creep down (KC homes -6% compared to May '05). You do the math.

(Puget Sound Business Journal, 06.06.2006)